

Gold has recently surpassed the range previously preventing bullish activity, specifically below the $1940 threshold. The decline in the Dollar Index, triggered by the less robust CPI data from the US, has made market participants feel hopeful about the potential for the Fed to achieve its highest interest rate during the July 26 FOMC meeting. The performance of gold this week has been notable, as it is poised to achieve its most robust performance in the last three months.

Source: TradingView
The DXY and declining Treasury Yields influence the market dynamics, as observed through the appreciation of the EURO and GBP about the Greenback. A more significant move was anticipated after the breakout, with the $1980 level appearing enticing. Nevertheless, the esteemed metallic asset has encountered difficulties surpassing the resistance zone at $1960, impeding any endeavors to achieve additional advancements. On Friday, there was an attempt by Treasury yields to recover, with the 2Y, in particular, rising towards the 4.75% mark from a previous low of 4.6%. This movement could explain the lackluster performance of Gold on Friday, marking the end of the week. An examination of the upcoming week reveals what lies ahead for gold prices.
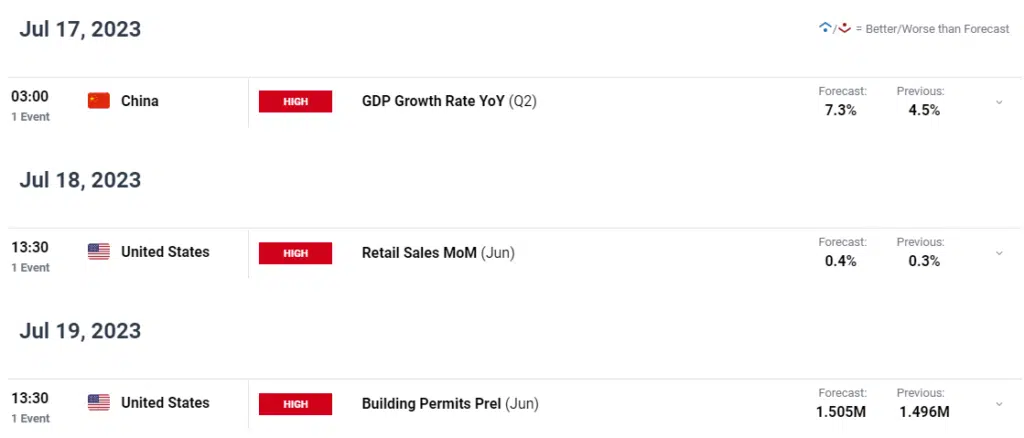
Data for Retail Sales, Building Permits, China’s GDP, and the Federal Reserve
Given the dismal economic outlook for the US Dollar and DXY, I expect Gold to continue its upward trend over the coming week. US retail sales and building permits will be the two high-impact data releases next week, and neither is expected to have much effect on the market. As a result, the DXY’s downward trend might extend further, with any attempts at an upward rebound likely being greeted with selling pressure. This, in turn, may encourage Gold bulls and bring the price of Gold closer to $2000.

The market expectation for a rate rise from the Federal Reserve at their July meeting has mostly stayed the same. Inflation data suggest that market participants’ expectations that the Fed will end its rising cycle with a rate rise in July are close to the mark. Because the Federal Reserve has entered the ‘Blackout Period,’ the Dollar will receive no encouragement from Fed officials over the weekend and a half leading up to the FOMC meeting on July 26.
Gold prices may also be affected by Chinese GDP statistics released early in the week, as the Asian nation continues to experience a sluggish economic recovery, as seen by weak import and export numbers. China is still a significant gold importer, and a slowing economy might raise concerns about future demand. Gold may use a lift, and recent rumors of a stimulus from the Chinese government bode well for the precious metal.
Gold prices and market volatility might be affected by the following three high-rated risk events on the economic calendar this coming week:
Closing Remarks
Gold is about to have its best week in three months, and the XAUUSD weekly chart has printed a Morningstar candlestick pattern. We can’t claim there was no sign from a technical standpoint since the 50-day moving average (MA) moved above the 100-day MA (100-day MA) after last week’s closing, suggesting additional gains.
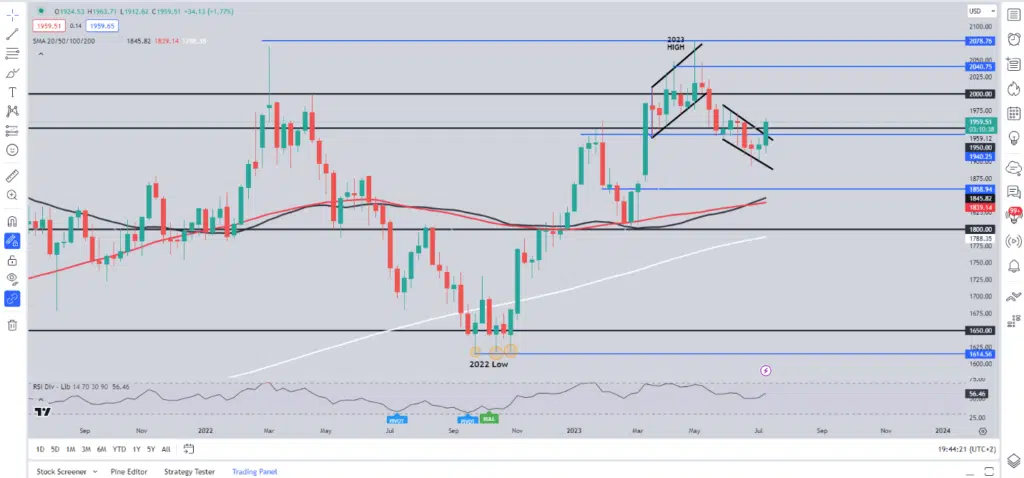
XAU/USD Weekly Chart – July 14, 2023. Source: TradingView
Transitioning to a daily timeframe, it is intriguing to observe the emergence of a death cross pattern, which intriguingly contradicts the weekly analysis. The potential explanation for the Gold bulls’ inability to fully capitalize on the decline in the DXY this week could be attributed to certain factors. The daily candle on Friday is heading towards a doji close, potentially indicating a possibility of a pullback early next week. The initial support levels to watch are around 50- and 100-day moving averages, positioned at $1954 per ounce. A potential downward movement may lead to a retest of the bull flag breakout zone within the $1935-$1940 range.
Based on the weekly and daily charts analysis, a potential upward movement from the current position may encounter a resistance zone near the $1980 level (indicated in pink on the chart) before reaching the significant milestone of $2000.
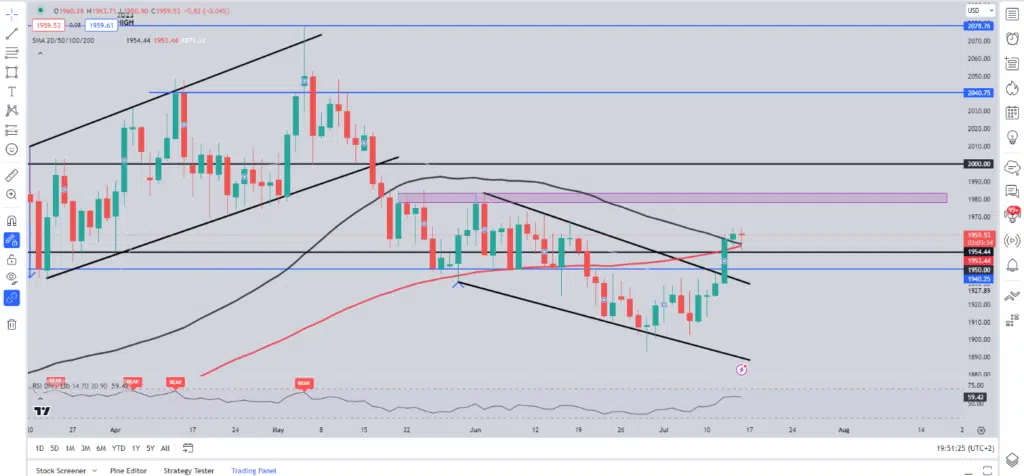
XAU/USD Daily Chart – June 14, 2023. Source: TradingView