- The price of crude oil has experienced a retracement from significant resistance levels. However, it has yet to breach any established support levels.
- The sustained upward momentum observed in the natural gas market over several weeks is currently experiencing a decline.
- The current market conditions surrounding crude oil and natural gas warrant a comprehensive analysis of their respective outlooks. It is imperative to monitor critical levels that may significantly impact these commodities closely.
Is There Any More Room for Natural Gas Prices to Improve?
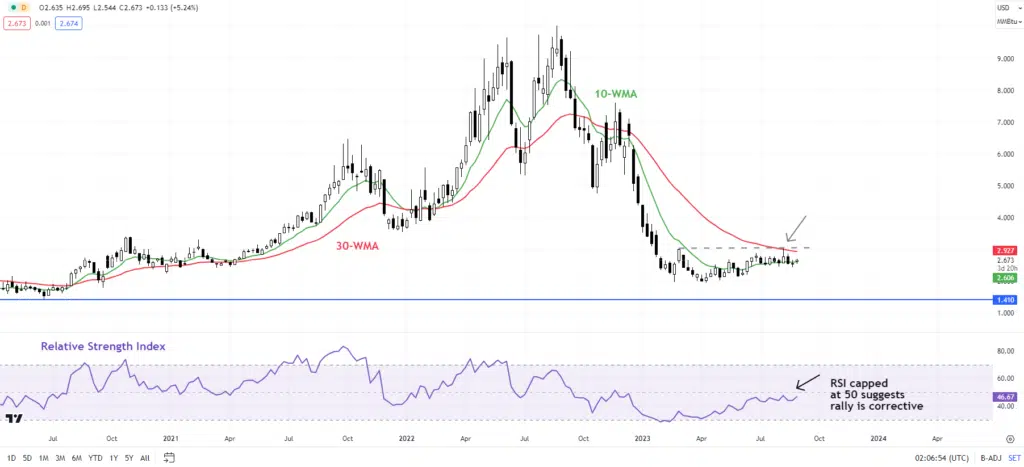
There is an increasing likelihood that the duration of the five-month recovery period has reached its conclusion. The decline in the value of natural gas below the threshold of 2.57 in mid-August indicates that the ongoing recovery may be losing momentum. This potential risk was previously highlighted in the preceding update.
The scenario above results from an inability to surpass the significant barrier located at the range of 3.00-3.05, which encompasses the March high and the 30-week moving average. The observed price action exhibits a recurrent pattern of advancing by two steps and retreating by one step. This characteristic nature of the recovery suggests a corrective phase rather than initiating a fresh upward trend.
The current market conditions are subjecting natural gas to a critical examination of its horizontal support level, which is approximately situated between the range of 2.45-2.50. If the support level is breached, it would indicate that the previously observed upward momentum has diminished, thereby presenting the possibility of a decline towards the approximate May low of 2.00.
Natural Gas Weekly Chart

From a broader perspective, it is evident that natural gas has not experienced any significant upward momentum in recent months, indicating that the overall downtrend remains intact. The identification of a potential floor for natural gas prices was initially brought to attention in the early months of 2023.
Natural Gas Daily Chart

The observed inability to ascend toward the 200-day moving average in recent weeks serves as an additional indication of inherent fragility. Given the significant losses experienced in the previous year, it is plausible to consider that natural gas might necessitate an extended duration of foundational establishment before a sustainable upward trend.
What’s in Store for Crude Oil Prices?
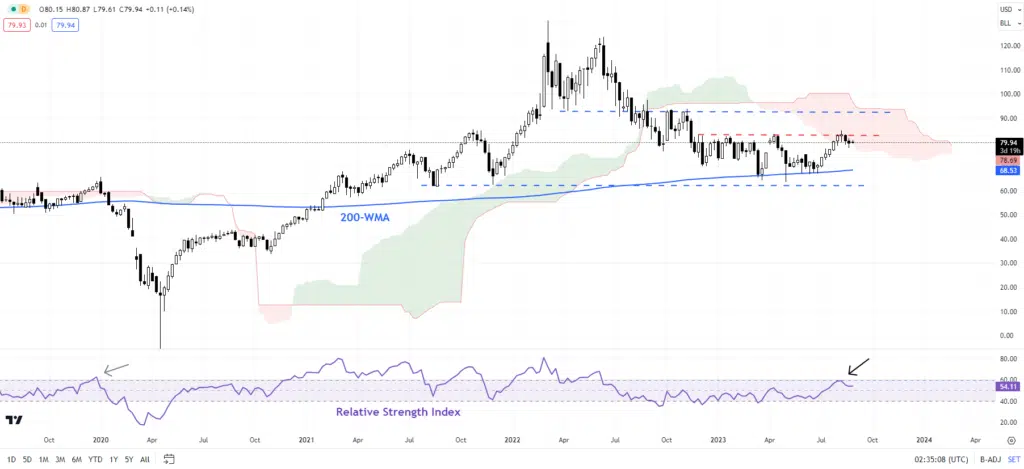
The upward trajectory observed towards the April high of 83.50, the breach of the Ichimoku cloud on the daily charts, and the surpassing of the 89-day moving average collectively indicate that crude oil is displaying signs of asserting its strength following a prolonged period of subdued price movements.
Crude Oil Daily Chart

In the most recent development, the price of crude oil has encountered significant resistance at the level of 83.50. However, the emerging upward trend observed since the conclusion of June has yet to reach its conclusion. For the short-term bullish bias to diminish, crude oil must decline below the Ichimoku cloud’s lower boundary on the daily chart. The prevailing trajectory of minimal opposition continues to exhibit a lateral to upward progression.
Crude Oil Weekly Chart

In recent months, the crude oil market has exhibited notable resilience by consistently finding substantial support at the 200-week moving average. A potential upward movement beyond 83.50 facilitates a path toward the October high 93.00. It is worth noting that this level resides near the upper boundary of the Ichimoku cloud on the weekly charts, approximately around 95.00. To facilitate a resurgence in the value of crude oil, the price range of 93.00-95.00 must be effectively surpassed.


